TempusParser & Plotter
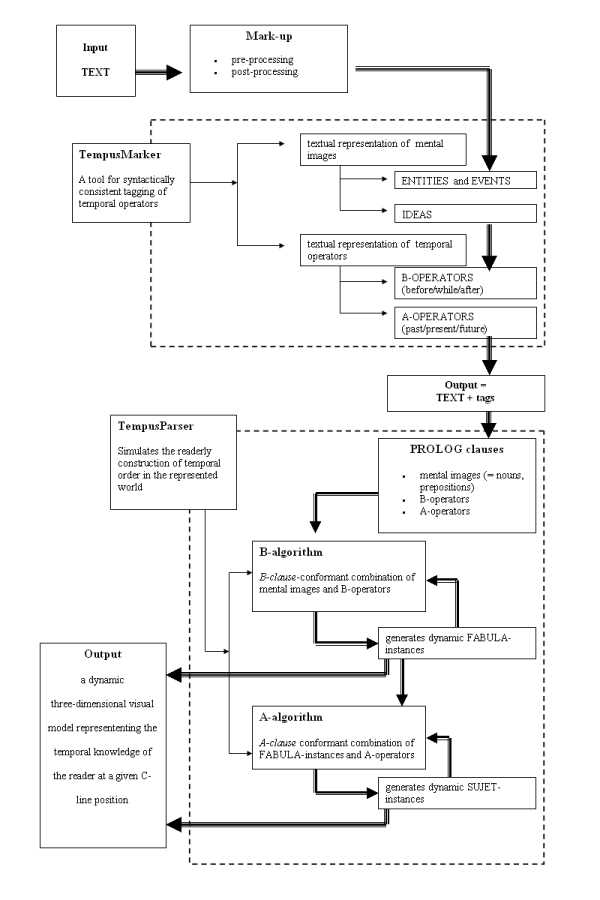
The following graph tries to visualize the computer aided modelling of the temporality effect attempted in our project.
The descriptive categories in our model are based on McTaggarts distinction between
- ‘B-relations’ ( = relational positioning of events in the physical continuum “before-after”) and
- ‘A-determinations’ ( = perception-based dynamic determinations of the chronological position of events within the continuum of perception / cognition of “past-present-future”).
For the purpose of our model ‘event’ is understood to signify any material or ideal entity denoted as existing within the narrated world by propositional statements that are expressed on the lexematic surface level – i.e., by words describing things and persons within the ‘world’, as well as their ideas or imaginations that are being represented as an intradiegetic – real or hypothetical – ‘fact’. – For further information please see my article Tagging Time in Prolog. The Temporality Effect Project.
TempusPlotter
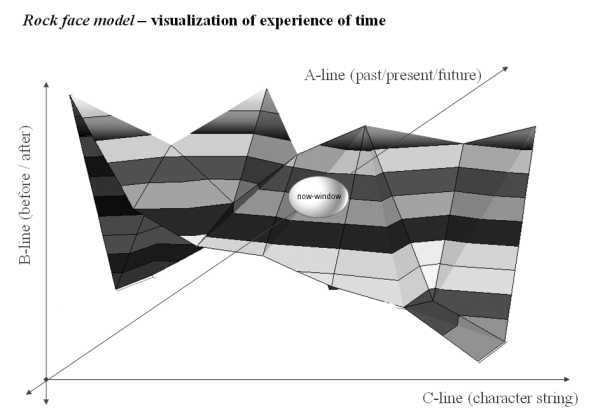
In a first step we explored the possibility to visualize the output generated by TempusParser in terms of the 3D rock face model of time experience.
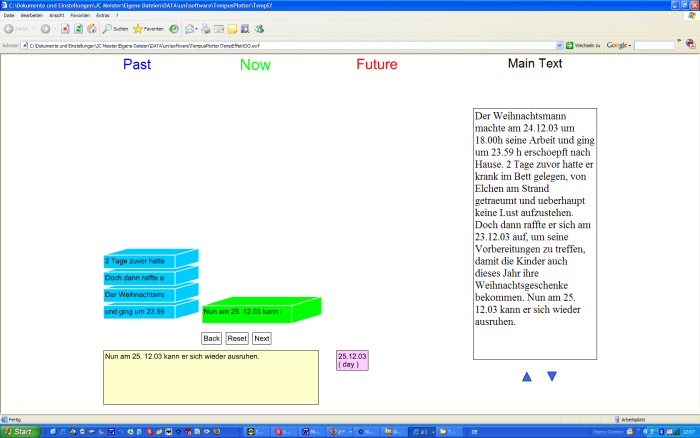
However, this model proved unsuitable to visualize the dynamics of linear processing of natural language descriptions of actions, such as given in narratives. Özgür Öczep therefore programmed TempusPlotter, a flash demo of a revised model which simulates the output of processing textual time cues (contained in the ‘Main Text’ box) in terms of a sequential re-positioning of ‘event blocks’. In the horizontal dimension we represent McTaggarts A-line (past / present / future); in the vertical dimension we represent his B-line (before / after).
You can download the TempusPlotter demo here and run it on your machine.
- make sure to extract all files into one directory
- then run the file TempEffektOO.swf
This should work, provided you have Flash installed (note: you may have to unblock scripts in your browser).


